
Introduction:
Creating Customized Compute Engine Instances, Custom Metrics, and Custom Time Series in the Google Cloud platform using Python and creating Dashboards for customized metrics using Terraform.
Key Points:
- Create an Instance using Python
- Create custom metrics and custom time series using Python
- Write templates for dashboards for customized metrics using Terraform
- See the results in the Monitoring service at Dashboards in the Google Cloud platform
Prerequisite
- Google Cloud
- Knowledge of Terraform
- Python
- Billing account
- Enable the Monitoring API
- Service account API
- Environment Variables
We must have a cloud project with billing enabled, and required monitoring APIs should be enabled and authenticated to our application with a service account by configuring an environment variable.
Cloud Monitoring and Dashboards
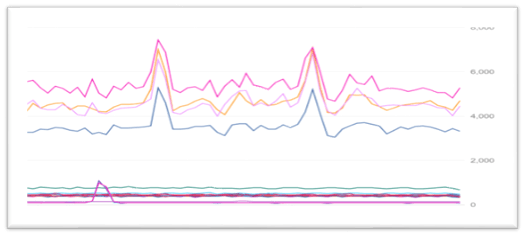
- Cloud Monitoring is also one service in Google Cloud Platform and it gives the analysis of various types of metrics like CPU utilization, CPU usage, network traffic, disk usage, and disk I/O of VMs as well. and it shows the result and reflects on dashboards with graphical representations like line charts, stacked-area charts, stacked-bar charts, and heatmap charts.
- The following screenshot is an example of a line chart image:
Creating Instance
Creating the instance and configuring the machine, i.e., zone, image name, image type, etc., with the create_instance() function in Python language.
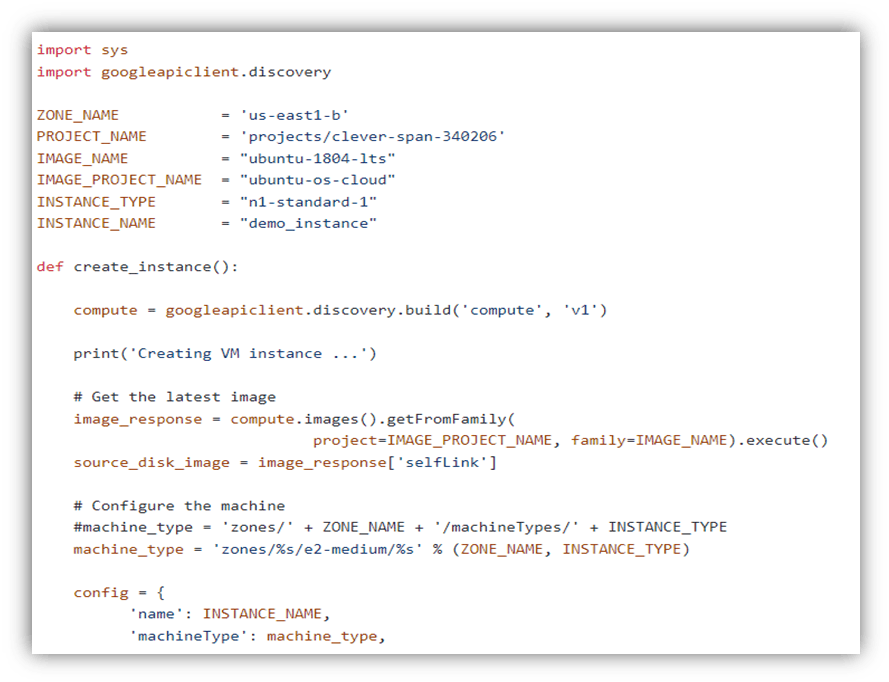 It will specify the boot disk and network interface to access the public internet and allow the instance to access cloud storage and logging.
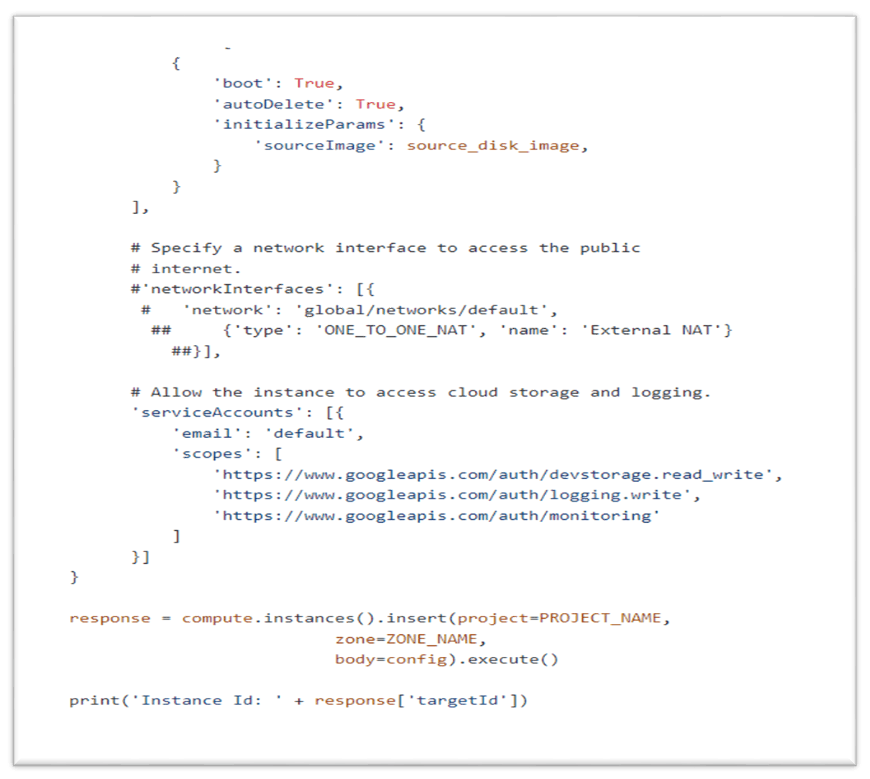
With this, we can create an instance in the Google Cloud platform.
Create Custom Metrics and Time series
To create a custom metric, we define a Metric Descriptor object that specifies various information about the metric. When we write metric data, monitoring creates the metric descriptor based on the structure of the data we provide.
Creating Metric Descriptor
Determine the structure of the metric descriptor
- Specify metric name, display name, and descriptor of a custom metric. The display name is used in the console.
- Specify the project in which the custom metric is defined. When we want to use these custom metrics in different projects, we need to mention them with uniqueness in each project.
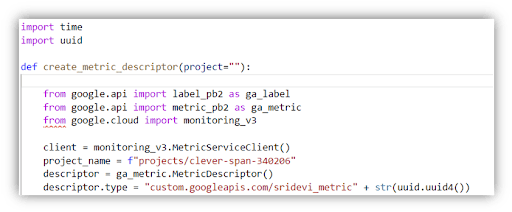
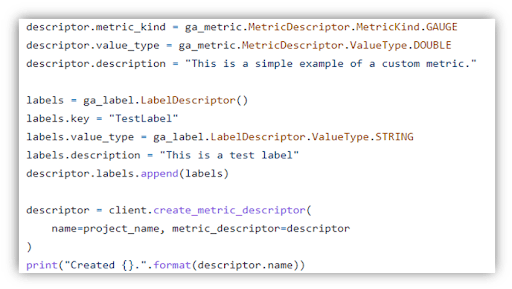
- Configure the metric's kind and value type, metric’s labels-names, value types, and descriptions.
- While creating a metric descriptor object, you must pass the argument to call the metricDescriptors.create method.

Creating Customized Compute Engine instance, Custom Metrics and Custom Time Series in google cloud platform using python and create Dashboards for customized metrics using Terraform.
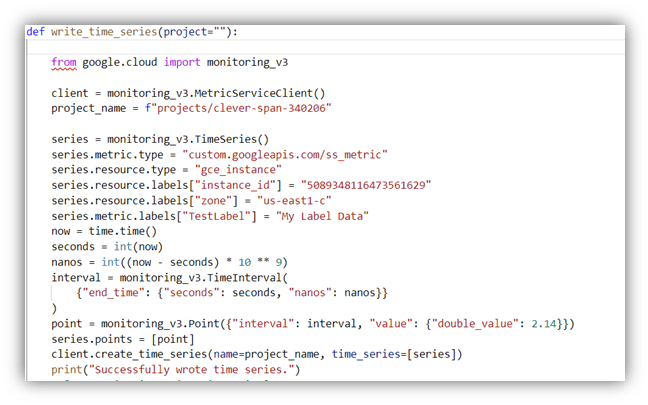
Time Series
- Custom metrics write data only for metric types with time series. Create a method to write the data and this will check whether time series exist or not. If a time series is available then this method appends the data or else it creates new data. Time series objects are identified by the metric values and resource fields.
- Every object of the Time Series contains only one object.:
- The metric type definition is applicable for the point's value and time interval. Look into the Time Intervals information of various types of metrics kinds.
- The point's time interval matches some point in the time series.
- The end time of the interval below 25 hrs in the previous record and 5 min in the further interval.
- Specify the instance ID in labels which are created earlier.
When we want to delete a custom metric, we delete the metric descriptor, but we can’t delete the time series data, which is stored in our Google Cloud project, and descriptor data is inaccessible when the metric descriptor is deleted.
Terraform
Terraform is one of the most popular Infrastructure-as-code (IaC) tools that allows you to build, change, and version infrastructure safely and efficiently used by DevOps teams to automate infrastructure tasks.
It is also used to automate the provisioning of our cloud resources. It is an open-source tool developed by Hashi Corp and written in GO language in the form of templates. Using these templates, we can create an infrastructure of any resources which we require.
Custom Dashboards and Charts
Custom Dashboards are also dashboards only created for our custom metrics, and these dashboards display the results of information about the customs metrics. It shows the result that reflects on dashboards with graphical representations like line charts, stacked-area charts, stacked-bar charts, and heatmap charts.
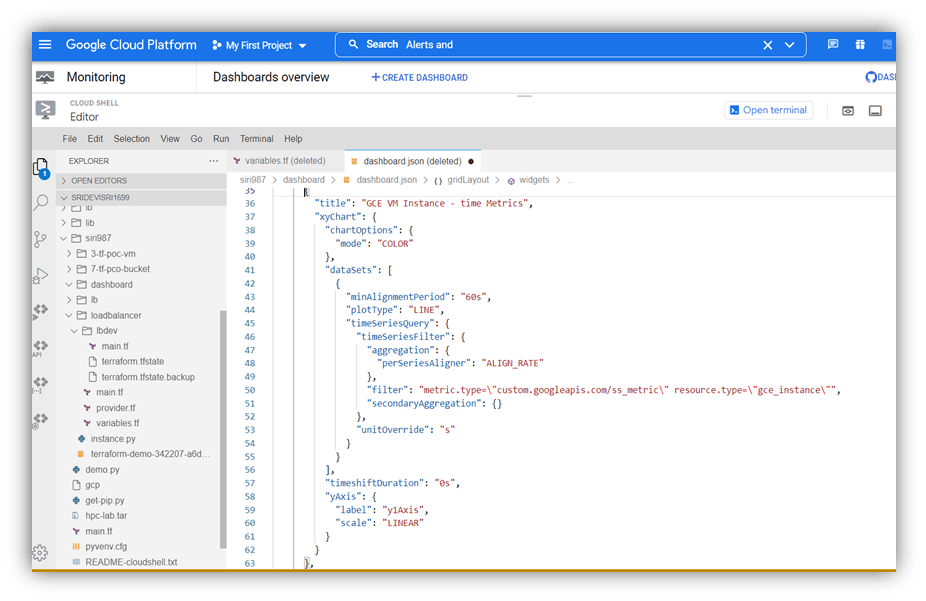
Creating the dashboards using the terraform code and design of the line chart must be mentioned in the .json file. This JSON file also mentions the path of our custom metric and the name of the instance in place of Filter as follows.
"filter": "metric.type=\"custom.googleapis.com/ss_metric\" resource.type=\"gce_instance\"",
Write the code for the creation of line charts using the dashboard.Json file as follows:
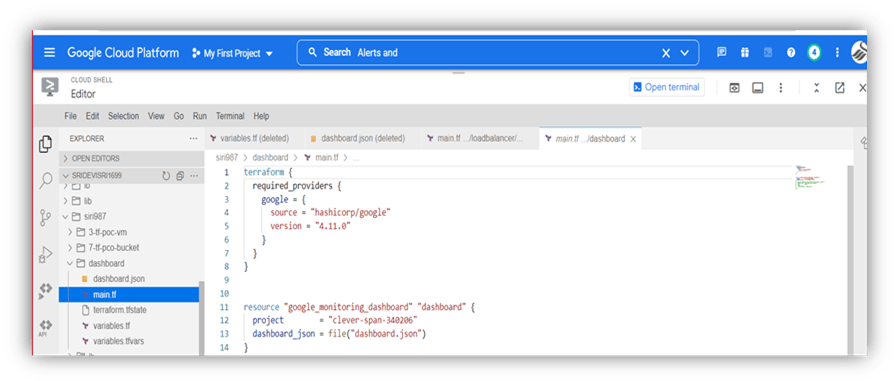
Edit main.tf file to create dashboards
In this file, the provider is mentioned as Google with version 4.11.0. under the resource mentioned, the project id and dashboard JSON file.
Run our files using Terraform commands like
- terraform init
- terraform plan
- terraform apply
- When we hit the terraform init command, it initializes the working directory
- When we hit the terraform plan command. It has a plan to create resources.
- When we hit the terraform apply, terraform will then deploy all the necessary resources.
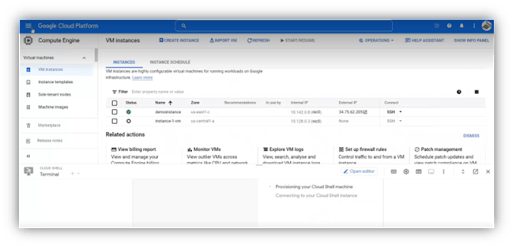
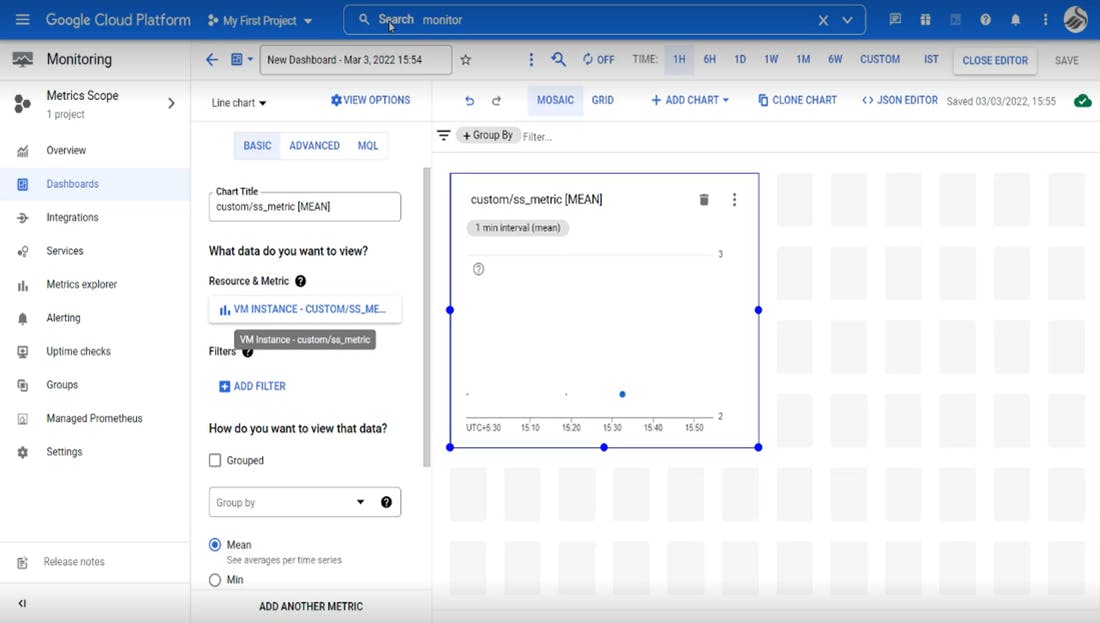
Output in Console
The following dashboard screenshot for custom metrics on Time series
Reference
Cloud Monitoring: Quickstart: Monitor a Compute Engine virtual machine | Cloud Monitoring | Google Cloud
Dashboards: https://cloud.google.com/monitoring/custom-metrics/creating-metrics
Terraform:https://registry.terraform.io/providers/hashicorp/google/latest/docs/resources/monitoring_dashboard
