Featured

Total Experience: A necessary strategy or just another buzzword?
Gaurav Bhatia, CMO of PenFed Credit Union, highlights Total Experience's role in uniting customer and employee engagement to enhance organizational resilience
Top stories
Video
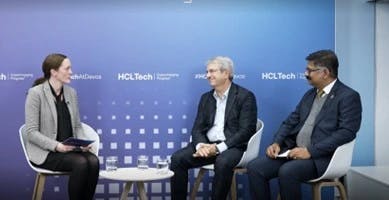
Agentic AI: The next phase of enterprise transformation
Piyush Saxena on moving beyond AI pilots and proofs of concept


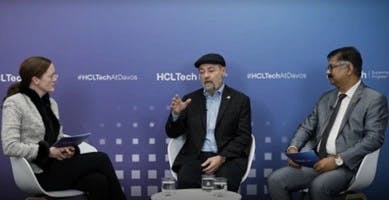
Total Experience: A necessary strategy or just another buzzword?


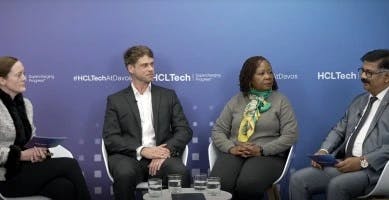
Strengthening the digital spine: How telcos can thrive through network transformation


Podcast

Episode 27: Responsible AI in the generative age
Nick Ismail and Heather Domin discuss the evolution of Responsible AI,...

Episode 26: AI and ethical innovation: Balancing a responsible future
In an HCLTech Trends and Insights podcast during the World Economic Fo...

Episode 25: Sustainable transformation in asset-heavy industries
In an HCLTech Trends and Insights podcast at Davos, Ajay Bahl discusse...

Episode 24: AI trends and responsible adoption: Insights from HCLTech at Davos
In this episode of the HCLTech Trends and Insights podcast, Nick Isma...

Episode 23: Emerging trends in the semiconductor industry
Explore the ever-evolving semiconductor landscape, uncover the catalys...
Subscribe to the HCLTech Newsletter
for our latest news and insights


 Gattu")


More Trends and Insights

Beyond GenAI: Why Agentic AI is the next phase of enterprise transformation
Piyush Saxena, SVP at HCLTech, explains how Agentic AI is helping businesses move from experimentation to execution and creating measurable value across industries

Generative AI: Balancing innovation with risk and responsibility
Enterprises adopting generative AI at scale must address sector-specific risks, rethink quality assurance and embed responsible governance to balance innovation with trust and compliance

Driving AI-powered transformation: Insights from the Digital Innovation Valley and HCLTech partnership
In an era defined by rapid technology changes, enterprises face unprecedented challenges and opportunities as they integrate artificial intelligence into their core operations

Rethinking GenAI strategy with small language models
By trading depth for speed, cost efficiency and privacy, the increased adoption of small language models could democratize AI technology

Navigating tariff turbulence in fashion and luxury with AI
Fashion and luxury brands are embracing AI to counteract tariff-driven disruptions and preserve margins, speed and brand prestige

Smarter, greener, stronger: The role of AI in enhancing energy efficiency and sustainability in data centers
AI transforms data centers into energy-efficient, sustainable ecosystems while supporting growth, predictive maintenance and carbon reduction goals

Gridlock to greenlight: Rewiring Australia and New Zealand energy for the net-zero era
Ajay Biswas, AVP at HCLTech, discusses how energy leaders in Australia and New Zealand (ANZ) can drive the energy transition through technology, sustainability and people-first strategies

The race to define Agentic AI standards: Open source vs. Big Tech
Competing frameworks are shaping the next software revolution. Who will win between open source and Big Tech?

Vibe coding: The silent revolution reshaping enterprise development in 2025
As AI augments coding, enterprises are moving from technical complexity to business clarity

The impact of DORA on financial services
DORA establishes strict security standards for EU financial institutions, focusing on ICT resilience and cryptography regulation

The future of data loss prevention: Shaped by AI and machine learning
AI and machine learning are set to revolutionize data protection and become the foundation for preventing data breaches and losses

The role of Agentic AI in Identity and Access Management
The emergence of Agentic AI is revolutionizing Identity and Access Management (IAM) by driving smarter, adaptive and secure solutions that strengthen protection against evolving cyber threats